
Two decades of growth for American students in reading and math were wiped away by just two years of pandemic-disrupted learning, according to national test scores released this morning.
Dismal releases from the National Assessment of Educational Progress (NAEP) — often referred to as the “nation’s report card” — have become a biannual tradition in recent years as academic progress first stalled, then eroded for both fourth and eighth graders. But today’s publication, tracking long-term academic trends for nine-year-olds from the 1970s to the present, includes the first federal assessment of how learning was affected by COVID-19.
The picture it offers is bleak. In a special data collection combining scores from early 2020, just before schools began to close, with additional results from the winter of 2022, the report shows average long-term math performance falling for the first time ever; in reading, scores saw the biggest drop in 30 years. And in another familiar development, the declines were much larger for students at lower performance levels, widening already-huge learning disparities between the country’s high- and low-achievers.
The results somewhat mirror last fall’s release of scores for 13-year-olds, which also revealed unprecedented learning reversals on the long-term exam. But that data was only collected through the fall of 2019; the latest evidence shows further harm sustained by younger students in the following years.
Peggy Carr, commissioner of the National Center for Education Statistics, said on a call with reporters that the “sobering” findings illustrated the learning losses inflicted by prolonged school closures and student dislocation.
“It’s clear that COVID-19 shocked American education and stunned the academic growth of this age group of students,” Carr said. “We don’t make this statement lightly.”
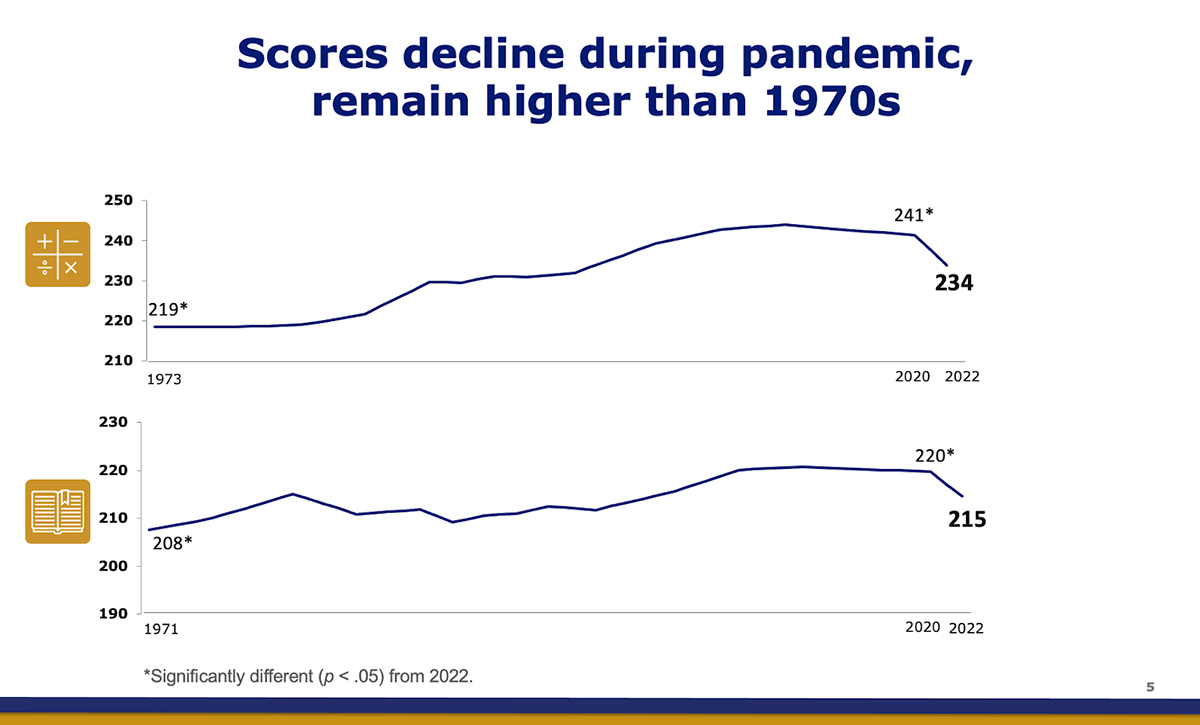
Average math scores for nine-year-olds sank by a staggering seven points between 2020 and 2022, the only such decline since the long-term test was first administered in 1973. Average reading performance — generally thought to be less affected by schooling than math, and therefore theoretically shielded from pandemic shock — fell by five points.
Inevitably, that means that fewer students hit the test’s benchmark performance levels than two years ago. For math, the percentage of nine-year-olds scoring at 250 or above (defined as “numerical operations and basic problem solving”) fell from 44 percent of test takers to 37 percent this year; those scoring 200 or higher (“beginning skills and understanding”) fell from 86 percent to 80 percent; even the vast majority scoring at the most basic threshold of 150 (“simple arithmetic facts”) shrank slightly, from 98 percent to 97 percent, across the two testing periods.
No demographic subgroup saw gains on the test, but disparities existed in the rates of decline. For instance, math achievement for white nine-year-olds dropped by five points, but for their Hispanic and African American counterparts, the damage was even greater (eight points and 13 points, respectively). As a result, the math achievement gap between whites and African Americans increased by a statistically significant amount.
In reading, scores for African Americans, Hispanics, and whites were all six points lower, leaving relative gaps unchanged. Scores for Asian students only fell by one point.
Notably, the long-term trend assessment differs somewhat from the main NAEP test administered every two years. It follows student performance going back a half-century, and it is taken with a paper and pencil instead of digitally. For the most part, testing items are unchanged from the early 1970s, assessing more basic skills of literacy and computation than are generally seen on the main NAEP.Related:NCES Chief ‘Nervous’ about Student Test Results as Nation’s Report Card Resumes
The broad trend-line has been positive over the life of the exam, and even in the most recent release, student scores on both subjects are far higher than when they were first measured. But Dan Goldhaber, a researcher and longtime observer of student performance, said it was striking to see that upward momentum evaporate so quickly.
“A bit of a hidden story in education, when you look at a swath of 40 or 50 years, is the progress that students have made — and the disproportionate progress that historically marginalized students have made,” said Goldhaber, the of the Center for Analysis of Longitudinal Data in Education Research (CALDER) at the American Institutes. “We’re seeing a lot of that very long-term progress completely erased over the course of a couple of years.”
‘Particularly bad’
One of the most consistent, and consistently worrying, findings of previous NAEP rounds has been the sharp disjunction of students at either end of the performance scale. For over a half-decade, high-scoring students have generally performed a point or two better with each iteration of the test — or at least stayed at the same level — while low-scoring students have seen their scores fall.Related:A ‘Lost Decade’ for Academic Progress? NAEP Scores Remain Flat Amid Signs of a Widening Gap Between Highest and Lowest Performers
The phenomenon of growing outcome gaps is again apparent in the post-COVID results, though it takes a slightly different form. At all performance levels across both subjects, nine-year-olds experienced statistically significant declines in their scores; but even with the identical downward trajectory, struggling students lost so much ground that disparities still expanded.
In reading, nine-year-olds scoring at the 90th percentile of all test takers in 2022 lost two points compared with their predecessors in 2020. But students scoring far below the mean, 10th percentile fell by 10 points.